 [Image: By Jack van Wijk, Eindhoven University of Technology].
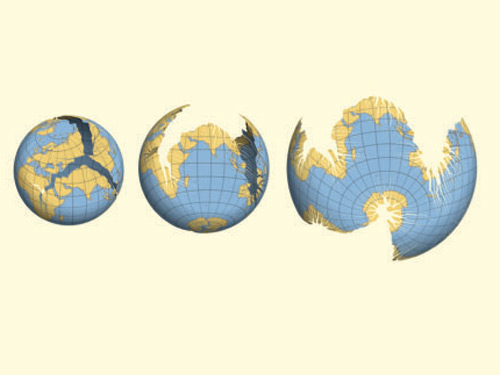
My brother pointed out this series of maps over at New Scientist. Combining a Buckminster Fuller-like interest in the most efficient way to map a sphere in two dimensions with a deployment of new algorithms, the maps show alternative ways of representing the earth’s surface.
 [Images: By Jack van Wijk, Eindhoven University of Technology].
“Making truly accurate maps of the world is difficult,” New Scientist points out, “because it is mathematically impossible to flatten a sphere’s surface without distorting or cracking it. The new technique developed by computer scientist Jack van Wijk at the Eindhoven University of Technology in the Netherlands uses algorithms to ‘unfold’ and cut into the Earth’s surface in a way that minimises distortion, and keeps the distracting effect of cutting into the map to a minimum.”
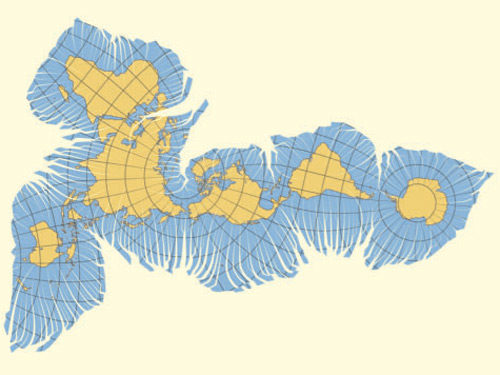
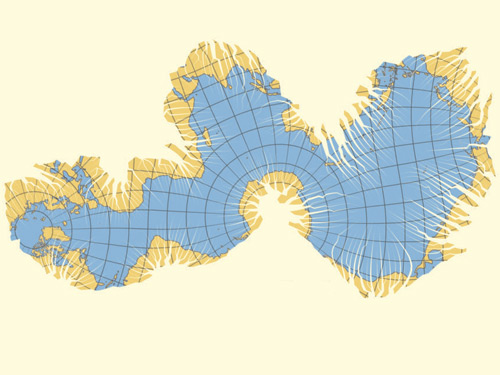 [Image: The world as a near-continuous coastline around one global ocean. By Jack van Wijk, Eindhoven University of Technology].
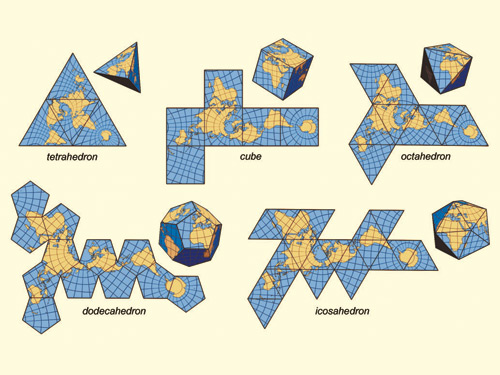
In van Wijk’s own abstract, published by The Cartographic Journal, we read that these “myriahedral projections,” as they’re called, “are a new class of methods for mapping the earth”:
The globe is projected on a myriahedron, a polyhedron with a very large number of faces. Next, this polyhedron is cut open and unfolded. The resulting maps have a large number of interrupts, but are (almost) conformal and conserve areas. A general approach is presented to decide where to cut the globe, followed by three different types of solution. These follow from the use of meshes based on the standard graticule, the use of recursively subdivided polyhedra and meshes derived from the geography of the earth.
It would be amazing to see what effect this technique might have on a much smaller scale—if, for instance, you could run one of these cuts through a populated area like London, say, and watch as parts of the city fractal off to opposite sides of the planet, the city’s roads opened up into algorithmic fissures.
(Thanks, Kevin!)
Here's the opposite of your smaller scale proposal- one park or plaza, all balled up into a tiny planet. Came across these on flickr.
http://www.flickr.com/photos/track24/sets/72157603414373920/
KP
Another guy does these too-
http://www.flickr.com/photos/nylocations/345206060/in/photostream/
KP
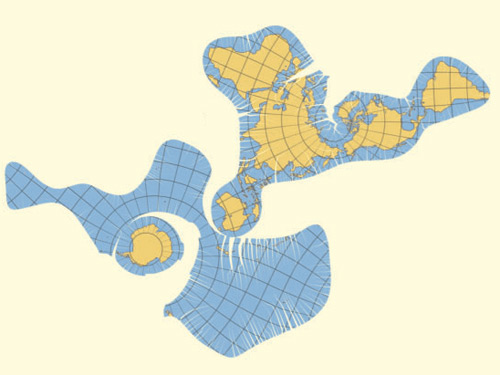
Interesting that the algorithm seems to only attempt to avoid distorting coastlines at the moment — at least, that's what I assume the reasoning behind unzipping the globe along the centers of land-masses, as opposed to the more normal ocean-breaking models. I can't see these as being very useful for land-based navigation, although sailors might like them.
What if it considered having mountain ranges presented 'correctly'; what would those projections look like?
What if it considered having mountain ranges presented 'correctly'; what would those projections look like?
Do you mean what would happen if they could project the complex, 3D crenellations, gorges, peaks, and geographic forms of mountains accurately onto a 2D surface? That's an amazing question! I have no idea what would that look like; I'd love to see it.
Unfolding the mountains? That would be incredible, but I assume the surface produced would be infinite (As is any coastline, according the Mandelbrot and Douglas Adams).
Nevertheless, does anyone have a 3D model of the earth (with topography)? You could feed it to Pepakura and see what happens.
Here's a link to the original article.
This could have interesting applications on 3D graphics, particularly Uv Mapping of complex shapes like Faces.
@humblefool: the focus points of the algorithm can clearly be redefined for different goals (i.e. the last image which is oceancentric, unzipped down the middle of continents, v. the two previous maps) so there is no real preference for sea or land based navigation in this method.
The post misses the significance of the work by only telling us that "with a deployment of new algorithms, the maps show alternative ways of representing the earth's surface." What is interesting about van Wijk's method is that it allows the faceting of the projection to be influenced by actual geographic (rather than only abstract geometric) organizations.
As everyone knows, no 2d map of the world is completely accurate. van Wijk has chosen to conserve the areas of shapes at the expense of preserving angles (like C.S. Peirce's quincuncial projection). However by having so many faces, and thus very little distance between the surface of the sphere and the projection planes, van Wijk manages to produce a map that is "(almost) conformal." Again, this is not entirely new and van Wijk's paper gives examples of other high-polygon maps. What is interesting is the ability to create high-polygon meshes based on geographic form and to control via weighted edge connections different continuity possibilities. Compared to these other maps van Wijk's projection presents a more accurate 'overall' image by aligning the small fissures orthogonal to coastlines.
@Felipe Budinich good thought! Though I imagine there is a point where it is easier to deal with uv stretching on highly complex shapes than the fissures this method would produce.
@Evan Chakroff, the difference between the peak of Mt. Everest and the bottom of the Mariana Trench is only 12.28 miles, an insignificant .15% of the earth's diameter (at the equator) and not even half of the 26.7 mile difference between the polar diameter and the equatorial diameter.
@Trevor Patt:
Funny, i was thinking about this post while showering today heh.
Actually I was thinking about using it for automatic unwrapping.
With the new tools for 3D painting, the fissures wouldn't be an issue, whereas rendering speeds could increase because you could reduce the number of texels being processed.
While negligible when doing standard renders, it could provide a noticeable increase in speed when doing real time rendering.
It would be harder (or downright not efficient) to compress this images with lossless methods, but these days, storage space is abundant, and we already do stuff like mip mapping that increases image size in one third.
i see fusion, not fissure. when the globe is unfolded and viewed at once it's unity is more apparent (bucky).
Don't forget Faumaxion…